Taking a Hard Look at the Chaotic Fall Economy
Getting Started: A Real Challenge
With the latest GDP growth estimate for second quarter coming in at a slow 1.5 percent, long-term interest rates at a peak for the year, federal debt at an all-time high, CPI inflation continuing apace at 3.4 percent, we have a perplexing situation . And then with food services and drinking places leading the way with 59,000 new hires, perhaps replacing deported people, as 162,000 workers were added to payrolls in August, the picture becomes even more complicated when we try to determine what the real economy is doing.
But there is more. Fold in an on-again, off again war with Iran, unprecedented expansion of the federal government in state-owned production of steel and petroleum, what some would call socialism, and deportation of more than one million immigrants by the Immigration and Customs Enforcement agency including approximately 400 each month recently from each of the two Carolinas, the economic situation is almost too complex to analyze.
And if all this isn’t enough to keep a dedicated construction CEO awake at night, then add in President Trump’s latest kick at the Federal Reserve Board, promising to place embargoes (not more tariffs but lock-outs) on countries that run a U.S. trade deficit unless the Fed cuts interest rates at its September meeting. And don’t forget to include Trump’s stated desire to possess Greenland, one way or another, to gain Canada as a 51st state, and maybe bring down the government of Cuba.
With so many moving parts to consider, it may be time to get back to some basics and use some maps and hard data to tell us how we may be doing here in the Carolinas. Perhaps by quietly reviewing some data and looking at some maps, our minds will form a better understanding of how each one of us may be faring in the days ahead.
Looking for Prosperity Across the States
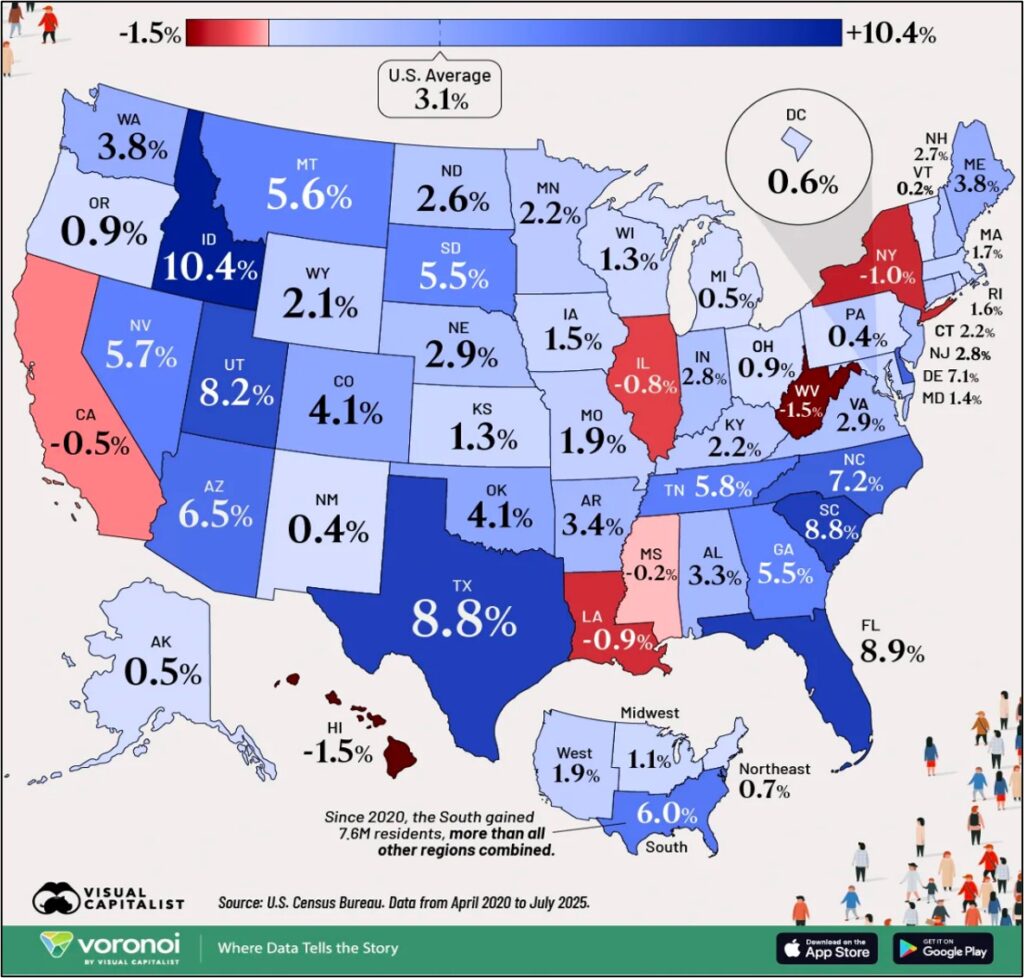
First off, we recognize that even in a slow-growth national economy, regional differences can be massive. Since people vote with their feet, population growth differences tell us about prosperity’s prospects. Loaded with data, the next map reports population growth across the 50 states for the years 2020-2025. First off, note that growth values range from minus 1.5 percent to plus 10.4. Then, note that the country’s northeast quadrant is the weakest U.S. region, and that the south is the strongest. As indicated, the two Carolinas are among the leading population growth states.
The Employment Driver
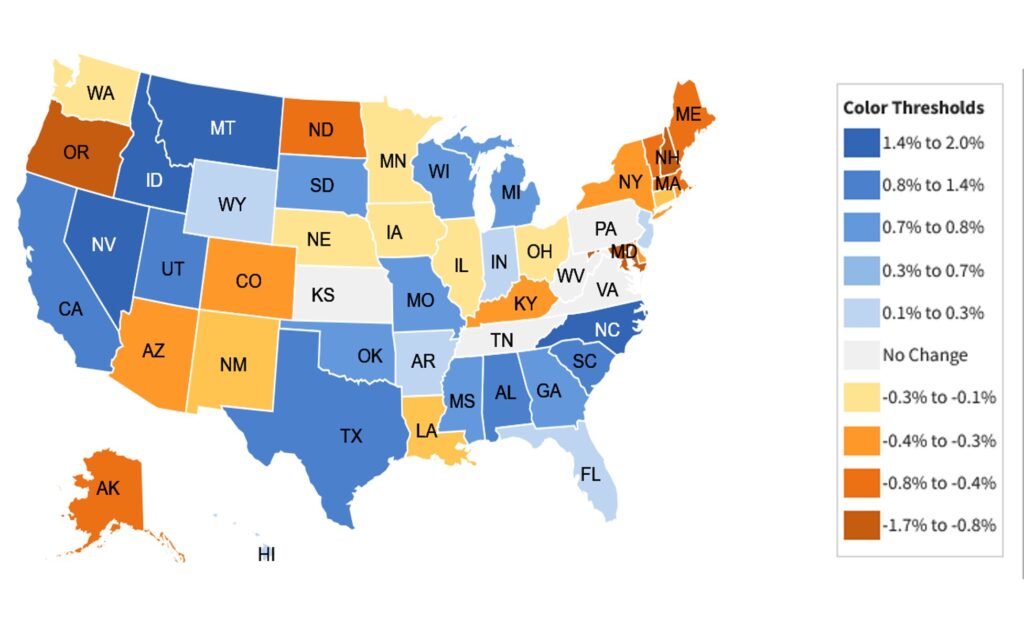
A decision to relocate is often associated with employment. The next map reports employment growth across the 50 states for March 2025 – March 2026. Once again, the northeast quadrant is weak, with hardly any employment growth at all. The south and especially southeast form strong regions.
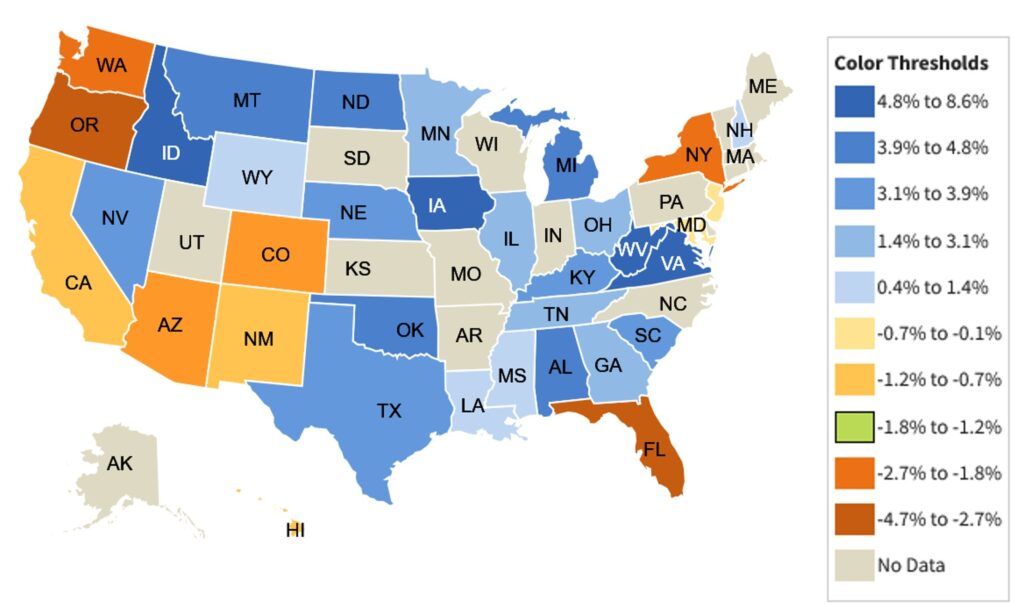
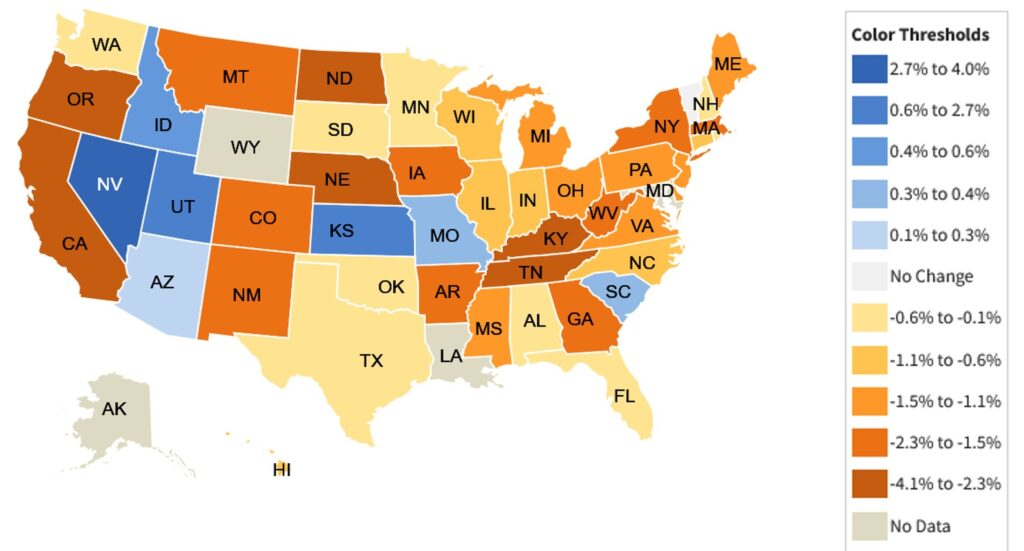
The next two maps provide data on construction and manufacturing employment for March 2025 through March 2026. Construction activity varies across the south and southeast, but is much stronger in those two regions than in the northeast. By comparison, employment growth in manufacturing hardly exists. Only eight states show growth, and South Carolina is one of those.
Future Prospects
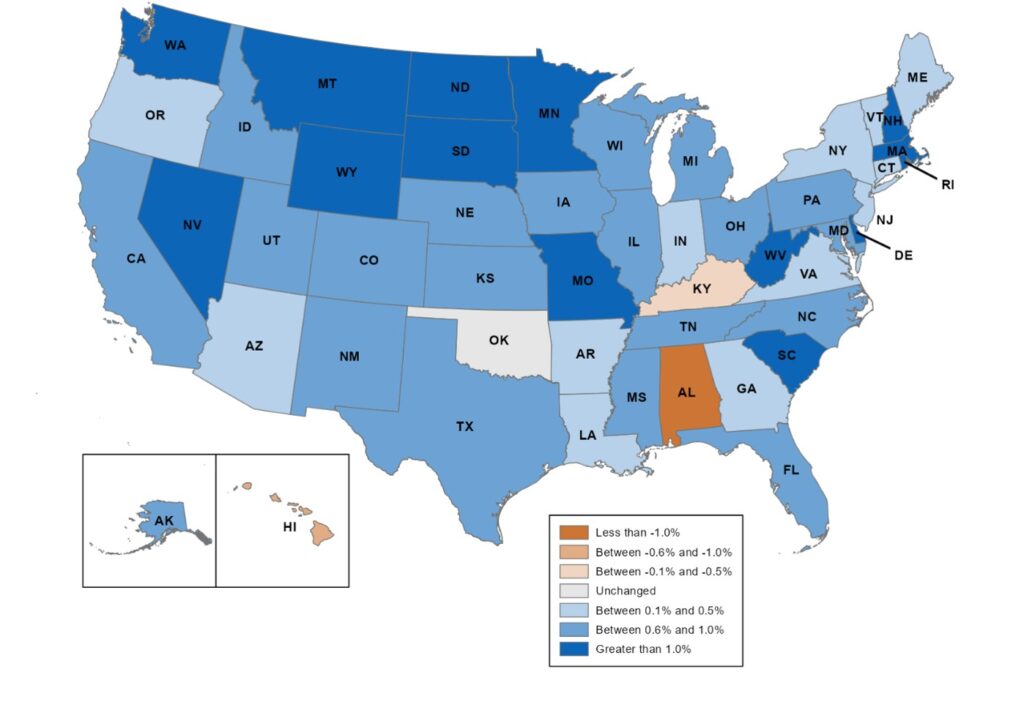
Let’s now close the rear-view mirror and focus on where state economies may be headed in the next few months. We do this by considering the July 2026 coincident indicator map produced by the Federal Reserve Bank of Philadelphia shown in Figure 5. The map shows lots of blue, which means that generally speaking the short-run outlook is good for most of the 50 states. But what about inflation?
LIVING WITH INFLATION
With immense White House pressure calling for lower interest rates, newly appointed Fed Chair Kevin Warsh received lots of attention when he argued that inflation represents a choice we make as a people. The Fed is a player in this and may be able to work against inflationary forces, but it is politicians that light the fire in the first place. This means that deliberate decisions taken by government officials to print money, expand debt, impose tariffs, bomb other countries, and ease credit provide the springboard to a resulting higher price level. Warsh recommended that those trying to figure out what the Fed is doing should focus on the ball not the referees who poll each other regarding what they think will happen.
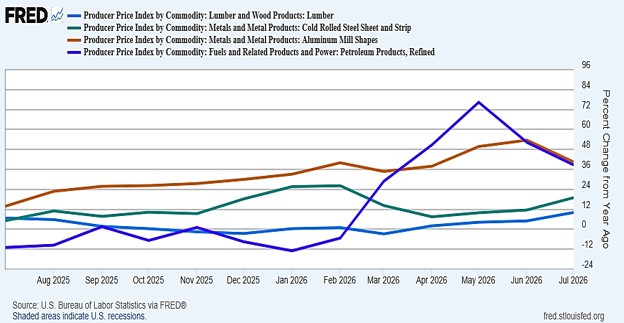
Recent increases in construction materials leave little choice but to focus on the ball. As indicated in Figure 6, which shows year-over-year increases for construction-related input price indexes, the indexes for fuels and aluminum shapes have risen 36% in the most recent period. The PPIs for lumber and cold-rolled steel products are also accelerating again. With Trump promising more tariffs on Canadian lumber and aluminum and the Fed printing money, there’s little reason to think we will see lower prices in the near future.
Final Thoughts
As we move into 2026’s final quarter, it is close to impossible to sort out the implications of almost daily changes in White House policies that affect economic activity. The changes and their direction are frequent and impossible to predict. Business decision makers are left to figure things out as best they can, to hope for calmer times in the future or find a way to make money out of the policy changes. This said, we can still gain insights as to what is happening by considering broad indicators of prosperity across the nation, which industries and activities are expanding or contracting, and how policy actions are determining changes in prices as well as prosperity.
Looking for words to describe the current situation suggests these: Prospects for prosperity depend on where you are located—which U.S. region—and being able to adjust to constantly changing labor and product markets. It turns out that those operating in the Carolinas have a lot to cheer about.