
An Economy on the Rebound: What’s Next?
The Department of Commerce’s first estimate for 2021’s fourth quarter real GDP growth came in at a resounding 6.9%, the highest quarterly rate since 1984, which also happened to be a year, like 2021, when the economy was rebounding from a severe recession. The 6.9% quarterly growth estimate was enough to yield 5.7% real GDP growth for 2021, topped only by, guess what, 1984’s 7.2%, a resounding rebound number.[i] I note that after 1984 the annual growth of real GDP settled down to run in the 3% to 4% range.[ii]
What should we expect for 2022 and 2023? Will this year be better than 2021? About the same? Or worse? In terms of GDP growth, not as good, but perhaps with a better outcome for inflation, which has been hitting 7%, as measured by the Consumer Price Index. And how about construction? Higher interest rates ahead suggest we should see a slowdown. But then there are some counter forces at play, like the new infrastructure spending that could start any time.
Let’s look closer.
Taking a Closer Look
As shown here, the Department of Commerce-provided graph of quarterly GDP growth for 2018-2021 captures the dramatic character of the COVID-19 induced economic collapse and rebound.[iii] I call attention to the larger than 25% magnitudes involved in the direction changes and ask the reader to consider how any kind of economic system might be resilient enough to respond to such large changes in direction without encountering severe problems? No wonder there are so many empty shelves and unfilled new car lots, price increases, packed ports, and new business starts in the U.S. economy.
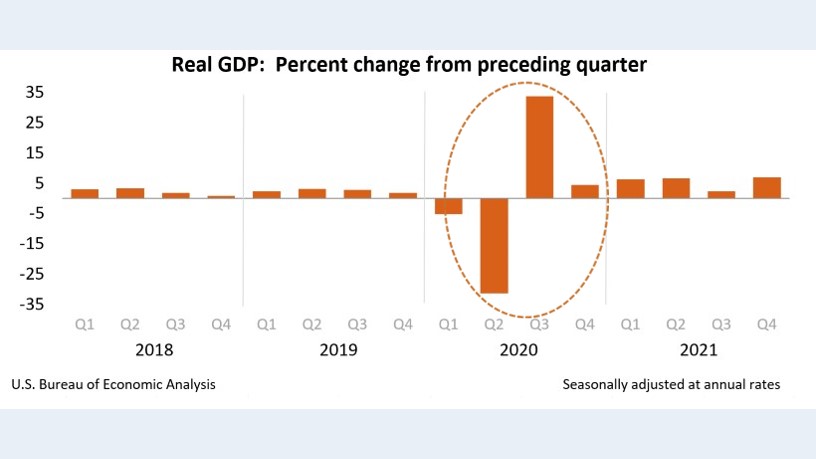
It’s worth remembering that the 1982-84 recession, one of the worst after World War II, was generated by deliberate slowing of the economy by the Fed in order to kill inflation. The economy was not shuttered by government action. This time, deliberate action was taken to shut down the economy in the vain hope that COVID 19 would be killed. Furthermore, unlike the 2020-21 recession, in the 1980s, there was not much in the way of stimulus treatment as there has been this time. Yes, in the 1980s there were extended unemployment benefits, but no, there was no “helicopter money,” billions and trillions of dollars distributed to American households and businesses so that practically everyone was able to have more money in the bank after the recession than before. There will be more on this below.
The Current Situation and Some Forecasts
As I see the current situation, we are dealing with the aftermath of a closed and restarted economy that is now on the rebound. The trillions of helicopter money are making a difference. Our most recent record-breaking GDP growth is rebound driven. Common sense and past experience tell us the recent pace will not continue, unless we get more helicopter money. So what can we say about the near future? What will the slower pace in 2022 and 2023 look like?
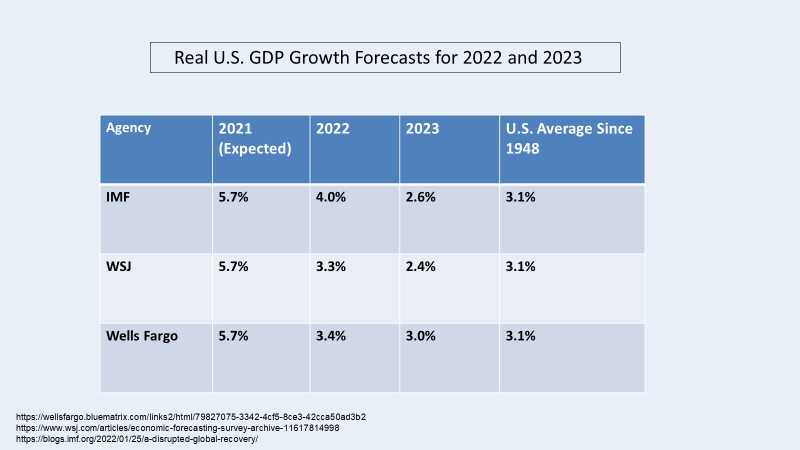
I provide here three estimates for 2022 and 2023 GDP growth along with data on the long-run average growth rate. As indicated, the International Monetary Fund, Wall Street Journal economics panel, and Wells Fargo Economics are calling for slower growth ahead that will tend to converge on the long-run average. The slower expected growth takes account of recent promises by the Fed to slow the economy.
The Washington Cash Flow
In early 2020, Washington leadership responded to the COVID crisis with major injections of newly printed dollars into consumer bank accounts and, to cushion the shutdown effects on countless small businesses and other organizations, with payments of Paycheck Protection Plan dollars (PPP) that enabled the previously employed to continue receiving a paycheck. With the new cash flow, the unemployed were often being paid at least three times, first by state unemployment compensation programs, then with a federal addition to the state programs, and finally with PPP and direct federal payment. In all, some $4 trillion entered the economy, and none of the new dollars were associated with newly produced goods and services. Instead, there were stacks of freshly printed dollars waiting to get connected with a limited supply of goods of services in a still COVID-affected economy.
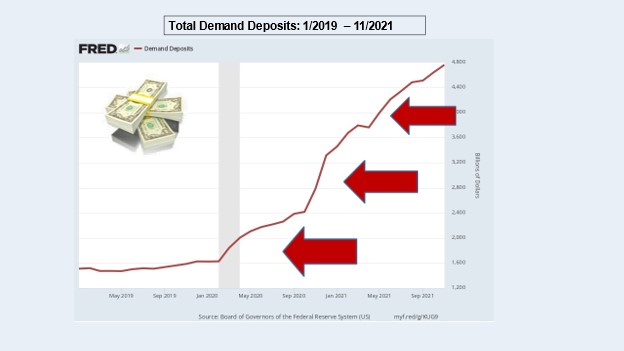
The flow of funds to consumers is partly captured by data on total demand deposits in the U.S. banking system.[i] This is shown in the next chart. Here, it is easy to see the stair-step expansion that occurred as dollars under different stimulus programs made their way into the economy. Note that in about 18 months the level of funds in demand deposits rose from $1.6 trillion, which was the previous norm, to $4.8 trillion. This implied there was more than $3 trillion in purchasing power waiting to move into the economy.
And Inflation Roared
The volatile rebound recovery of the turned-off and then turned-on, cash-fed economy left in its wake a path of price increases triggered by a combination of packed harbors, unavailable trucks and drivers, excess demand for auto, trucks, and other major consumer goods, and trillions of dollars chasing a restricted supply of goods and services. In a few words, what had been predicted by economists since Irving Fisher’s 1892 Yale dissertation[i] and later by John Maynard Keynes in his clearly written 1937 A Treatise on Monetary Reform came true again. When the supply of money in the economy grows faster than the supply of goods, the price level will rise. I show a reduced form of this in the next chart that contains data on growth in U.S. demand deposits and growth in the Consumer Price Index.[ii]
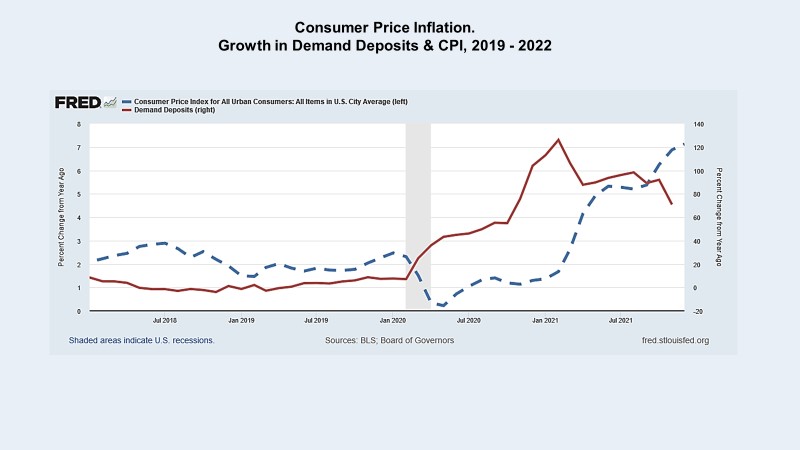
I call attention to the lag between money flowing into demand deposits and later CDPI-measured inflation. Given the current picture, the chart suggests that inflation growth will begin to subside as 2022 comes to an end. Note that I said inflation growth will subside, which is to say we will still have inflation but at a lower rate of growth.
What about construction prices? The next chart speaks to this question. Here I show the year-over-year increases for Producer Price Indexes for Construction Materials, New School Building Construction and Warehouse Construction. Notice the acceleration that has occurred in 2021’s latter half. This suggests that we will see a continuation of higher construction costs but with pressure relaxing toward the end of this year. By then the slowing effects of higher interest rates and the reduced flow of newly printed money will have ended. But that is not the end of the story. There is immense purchasing power building in the cash accounts of state governments for infrastructure and other improvements. So while price pressure is relaxing in parts of the economy, we may see an elevation coming from other parts.
Bottom line? 2022-23 look like continued good times for construction, but with a warning. Look out for interest rate increases!
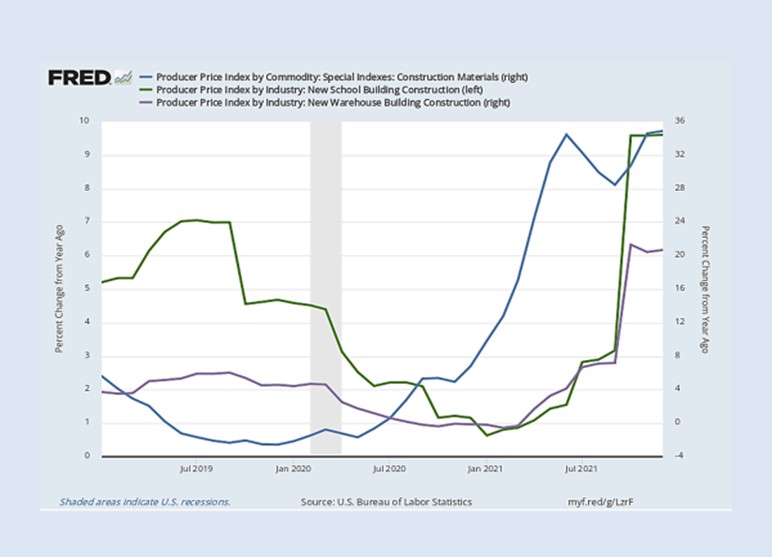
1/2019 – 12/2021
Bruce Yandle is Alumni Distinguished Professor of Economics, Clemson University, and Distinguished Adjunct Fellow with the Mercatus Center at George Mason University where his quarterly Economic Situation Report is posted.
[1] https://journalrecord.com/2022/01/27/us-economy-marks-5-7-growth-in-21-as-rebound-from-recession/
[2] https://fred.stlouisfed.org/series/GDPC1
[3] https://www.bea.gov/news/2022/gross-domestic-product-fourth-quarter-and-year-2021-advance-estimate
[4] https://fred.stlouisfed.org/graph/?graph_id=979663&rn=847
[5] https://fraser.stlouisfed.org/title/mathematical-investigations-theory-value-prices-6161
[6] https://fred.stlouisfed.org/graph/?graph_id=979663&rn=497#0


