August Construction Unemployment Rates Up From a Year Ago, Says ABC
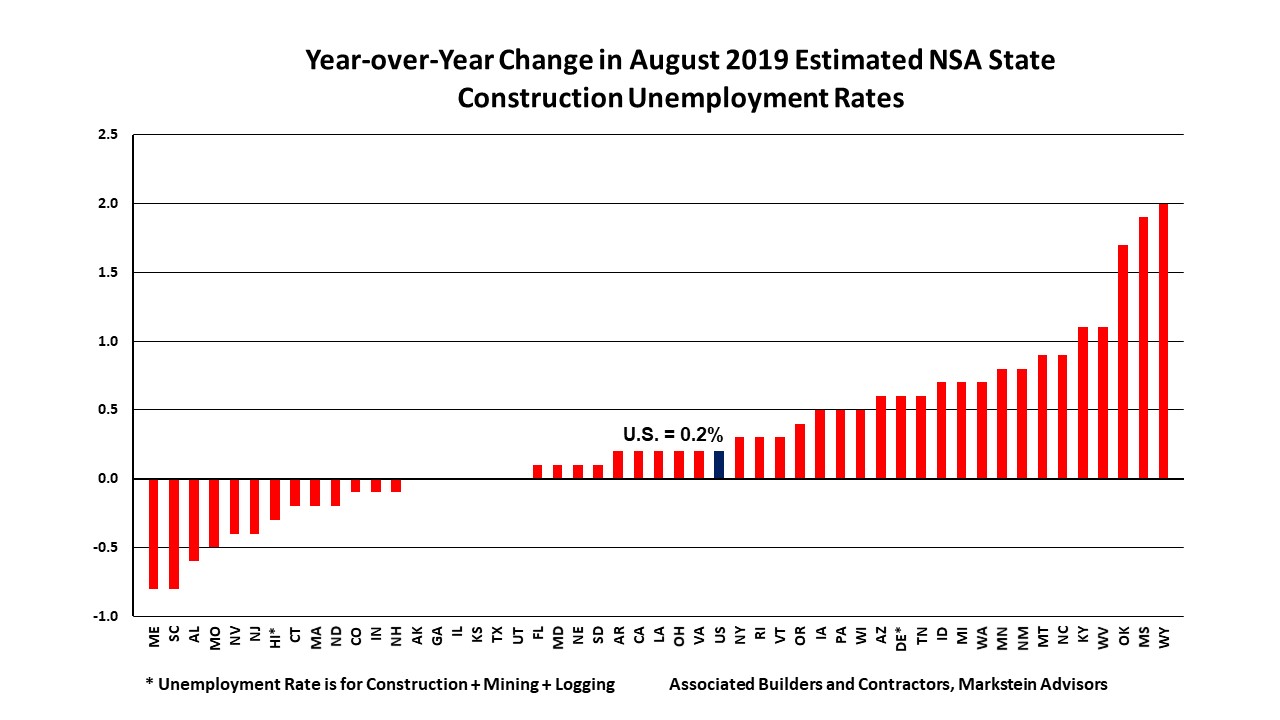
In August, estimated not seasonally adjusted construction unemployment rates rose nationally and in 31 states, fell in 13 states and remained unchanged in six on a year-over-year basis, according to an analysis of U.S. Bureau of Labor Statistics data released today by Associated Builders and Contractors. For the fourth month in a row, the construction unemployment rates for all 50 states were below 10%.
The construction industry employed 177,000 more workers nationally compared to August 2018, even as the August 2019 national NSA construction unemployment rate increased from 3.4% to 3.6% over the same period, according to BLS numbers. Although the growth in employment is a positive for the industry, there has been a troubling trend of declining growth in construction employment for close to a year now. August’s increase in year-over-year employment is the smallest increase since December 2016—158,000—which was an anomaly after almost four years of robust increases in construction employment. The slowdown in employment growth may be due to a combination of the shortage of skilled workers and the recent slowdown in construction activity (as of August, year-to-date construction spending was down 2.3% from the same period last year).
“In August, significantly high temperatures in much of the West and Southwest and generally above-average temperatures in much of the East may have hindered construction activity in those areas,” said Bernard M. Markstein, Ph.D., president and chief economist of Markstein Advisors, who conducted the analysis for ABC. “Meanwhile, higher building materials prices due to tariffs and the threat of additional tariffs have added to concerns about the outlook for construction, which have led to the scaling back of some projects and even the cancelation of a few proposed projects.”
Because these industry-specific rates are not seasonally adjusted, national and state-level unemployment rates are best evaluated on a year-over-year basis. The monthly movement of rates still provides some information, although extra care must be used when drawing conclusions from these variations.
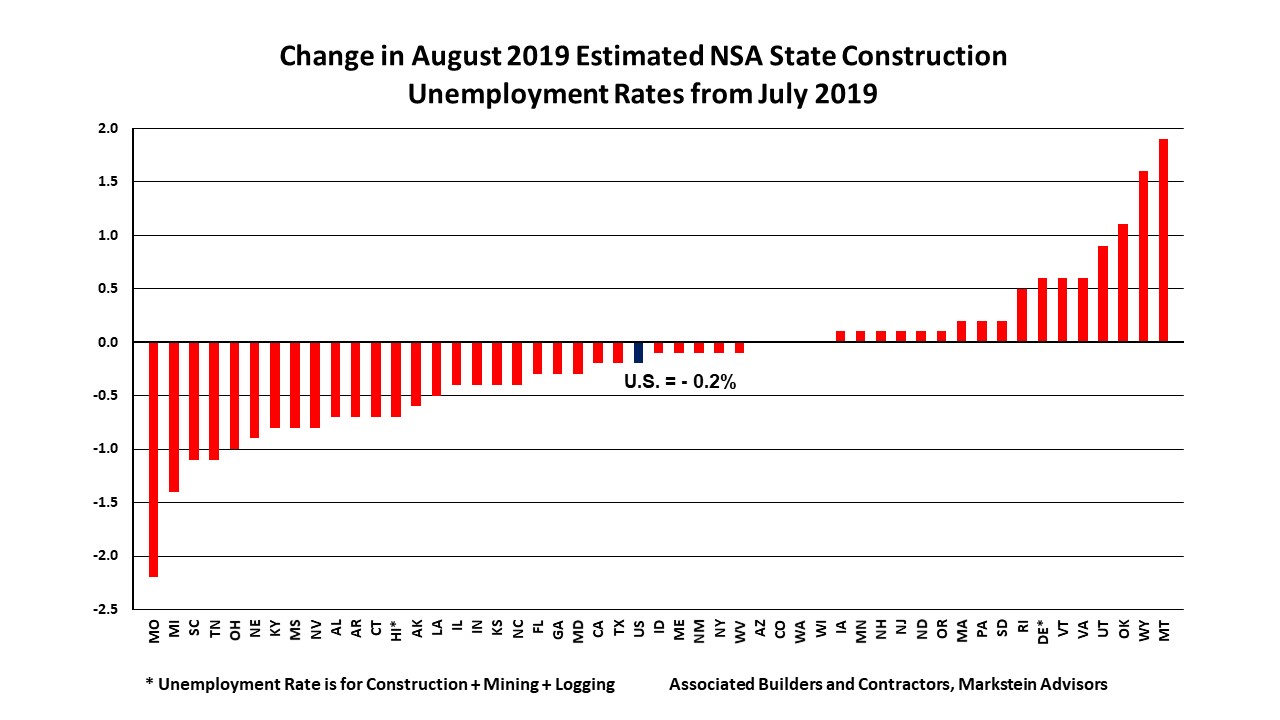
The national NSA construction unemployment rate fell 0.2% from July to August. There is no set historical pattern to the change in the rate from July. Since the data series began in 2000, there were nine decreases and eight increases, and twice the rate was unchanged. Among the states, 29 had lower estimated construction unemployment rates from July; 17 were higher and four were unchanged.
The Top Five States
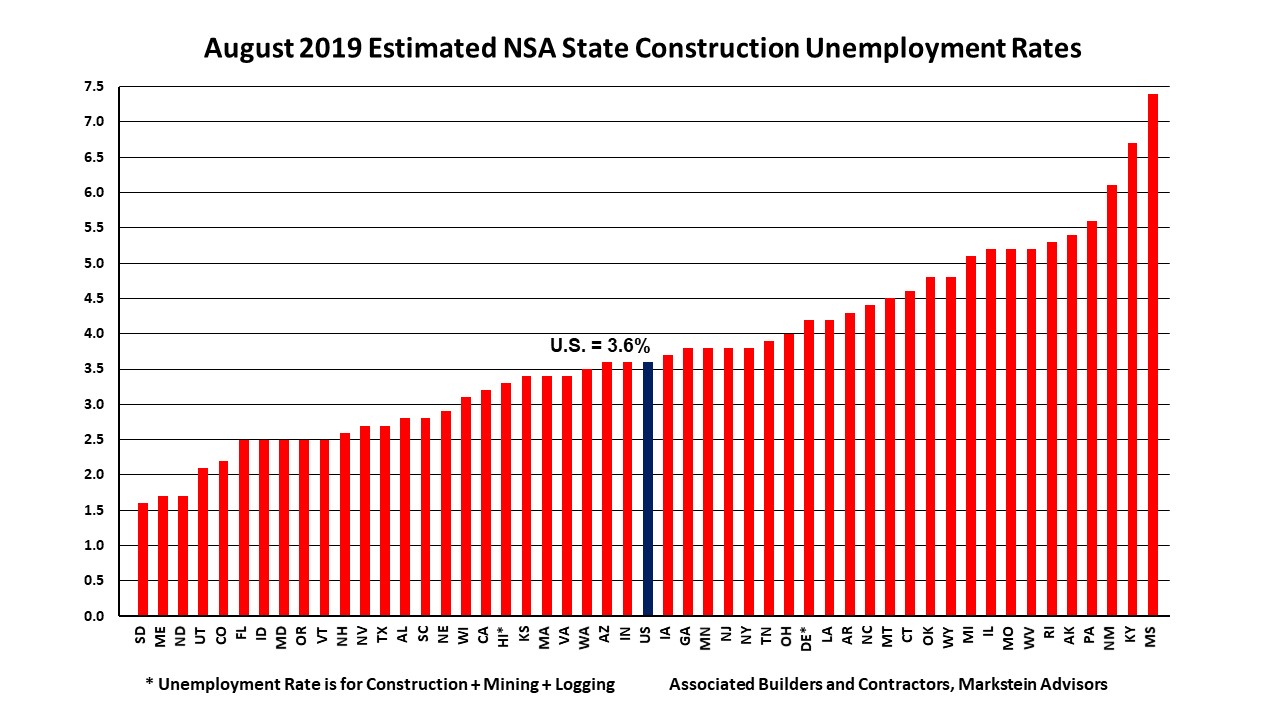
The states with the lowest estimated NSA construction unemployment rates in order from lowest to highest were:1. South Dakota, 1.6%2. Maine and North Dakota (tie), 1.7%4. Utah, 2.1%5. Colorado, 2.2%
All of these states except for Colorado were in the top five in July. South Dakota had the lowest construction unemployment rate in August. This was up from the second lowest rate in July based on revised data (originally reported as the third lowest rate). It was also the state’s second lowest August rate on record since it fell to 1.5% last year.
Maine and North Dakota tied for the second lowest rate in August. For Maine, this was up from fourth lowest in July based on revised data (originally reported as fifth lowest) and the state’s lowest August rate on record. The state also had the largest year-over-year drop in its rate, down 0.8%, tied with South Carolina. For North Dakota, this was up from third lowest in July based on revised data (originally reported as tied with Utah for lowest) and was North Dakota’s lowest August rate since the 1.1% rate in 2015 and matching its August 2016 rate.
Utah had the fourth lowest rate in August, down from the lowest rate in July. This rate, which matched last August’s rate, was the state’s lowest August rate since its 1.4% rate in 2015.
Colorado had the fifth lowest rate in August, up from sixth lowest in July. It was the state’s lowest August rate on record, matching its rate in 2000.
Vermont, which had the fifth lowest rate in July based on revised data (originally reported as the fourth lowest rate), slipped to sixth lowest in August at 2.5%, tied with Florida, Idaho, Maryland and Oregon. It was also Vermont’s second lowest August rate on record, behind a rate of 2.2% last year.
The Bottom Five States
The states with the highest estimated NSA construction unemployment rates in order from lowest to highest were:46. Alaska, 5.4%47. Pennsylvania, 5.6%48. New Mexico, 6.1%49. Kentucky, 6.7%50. Mississippi, 7.4%
Three of these states—New Mexico, Kentucky and Mississippi—were also in the bottom five in July. For the fourth consecutive month, Mississippi had the highest estimated construction unemployment rate.
Kentucky had the second highest rate in August, the same as in July based on revised data (originally reported as the third highest rate).
New Mexico had the third highest rate in August, compared to fifth highest in July. This was the state’s second lowest August rate since dipping to 4.3% in 2008.
Pennsylvania had the fourth highest rate in August compared to eighth highest in July. This was the state’s second lowest August rate on record since dropping to 5.1% last year.
Alaska had the fifth highest rate in August, compared to sixth highest in July. Matching last August’s rate, this was the state’s lowest August rate since its 4.4% rate in 2001.
Michigan, which was fourth highest rate in July, improved appreciably to 10th highest in August with a 5.1% construction unemployment rate and the second largest monthly decline (down 1.4%). This was Michigan’s second lowest August rate on record behind last year’s 4.4%.
Missouri, which was third highest rate in July based on revised data (originally reported as second highest), improved to seventh highest in August with a 5.2% rate (tied with Illinois and West Virginia). The state had the largest monthly decline (down 2.2%) and the fourth largest year-over-year decrease (down 0.5%). This was Missouri’s lowest August rate since its 4.6% in 2000, making it the state’s second lowest rate on record.


To better understand the basis for calculating unemployment rates and what they measure, see the article Background on State Construction Unemployment Rates.


