Football Season, Election Season, and the Economic Outlook
With September’s arrival, those who love college football are again enjoying tailgating, touchdowns, the sound of marching bands, and crowds cheering and singing their alma mater. Hope for a conference championship reigns supreme. Nothing beats winning.[1]
And then those who get their thrills from politics, cheering crowds, music, and political cheerleaders can enjoy an endless flow of speeches, debates, promises, and constant TV commentary as each competing White House candidate tries to convince an American majority that only he or she can save the republic from extinction. Each major party hopes to win the Super Bowl of politics: four years in the White House. Again, nothing beats winning.
But while both Republican Donald Trump and Democrat Kamala Harris have their own ideas about how they can push and pull the economy to satisfy their favored special interest groups to gain enough votes to win, there is no doubt about their desire to stand at the nation’s gate, take on more federal debt, and pass out targeted benefits.
No Free Lunch
It is “crazy season” in the political realm, and there are a lot of “free lunches” being promised. Whether it be tax money for home downpayments, reduced corporate taxes, elimination of tip and Social Security taxation, or mandating free medical services for improving the birth rate, the two candidates stand ready to bargain for votes. And as committed gatekeepers, both candidates hope to determine who may purchase an American corporation, who and what may enter the nation from abroad, which cars, which chips, and which people.[2] Even though free lunches are promised, we all know that when we the taxpayers are considered together, there is no such thing as a free lunch. Yes, the bill will be paid, now or later, by someone.
Unfortunately, for America’s seemingly forgotten consumers already burdened with the previous rounds of Trump–Biden border taxes, the promised higher tariffs, which may benefit organized labor and specialized communities, will simply make the average American poorer. “The forgotten men and women” to whom the 2024 Republican platform is dedicated and who were mentioned in Donald Trump’s 2016 inaugural address will show up in speeches but otherwise remain politically out of mind.[3]
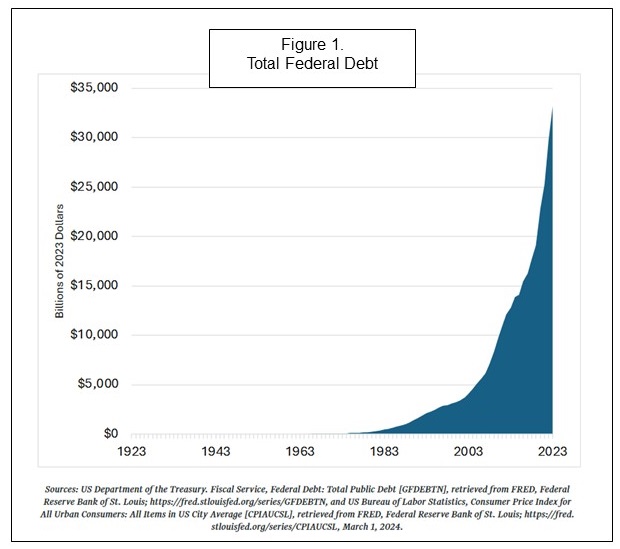
The unprecedented debt expansion across the last two administration provided the steam for strong consumer spending, infrastructure improvements, and subsidies to politically favored industries. As shown in Figure 1, developed by the American Institute for Economic Research, the amount of debt to be paid has skyrocketed.[4] Interestingly enough, none of the candidates for national office seem interested in discussing how we as a nation will pay down the debt. We can say the same thing about Medicare and Medicaid, which are destined soon to run out of funds, or the need to upgrade the nation’s environmental statutes. Apparently, they are not interested in dealing with these long-run issues because we voters are not interested. Unfortunately, those cans continue to be kicked down the road.
Is the Roller Coaster Ride Over?
Since 2007, we Americans have been riding on an economic roller coaster, wondering if the ride with ever end. Just to put some dimensions on the roller coaster turbulence experienced since 2007, consider this.[5] The unemployment rate stood at 4.7% in October 2007. It rose to 10.0% in October 2009 during the recession, just two years later. The rate then plummeted as the economy became flush with stimulus money and hit 3.5% in February 2020. Then, with COVID shutdowns, the unemployment rate jumped to 14.8% in April 2020, the largest one-month increase since 1939. It then fell to 3.4% in April 2023, after the Fed continued to cut interest rates, but rose to 4.3% in July 2024 following a Fed policy reversal. We are almost back where we started in 2007.
Whew!!! What a ride!
The Fed’s goosing and then braking actions delivered higher interest rates, which in turn took a bite out of economic activity. The effects are seen in the average interest rate paid nationwide for 30-year fixed-rate mortgages. The rate paid in third quarter 2007 stood at 6.55%. This was before the 2008 Great Recession, COVID and the later battle against inflation. Long after the recession, in the fourth quarter of 2012, when the economy was flooded with money, the rate fell to 3.36%. Then, when the Fed reversed engines and began to tighten, the mortgage rate rose to 4.78% in 2018’s fourth quarter. In early September 2024, it hit 7.0%.[6] When the trip started in 2007, the mortgage rate stood at 6.55%. We are almost back.
What a ride! But Jerry Lee Lewis might have put it, there was “a whole lotta shakin’ goin on.”
What about Inflation?
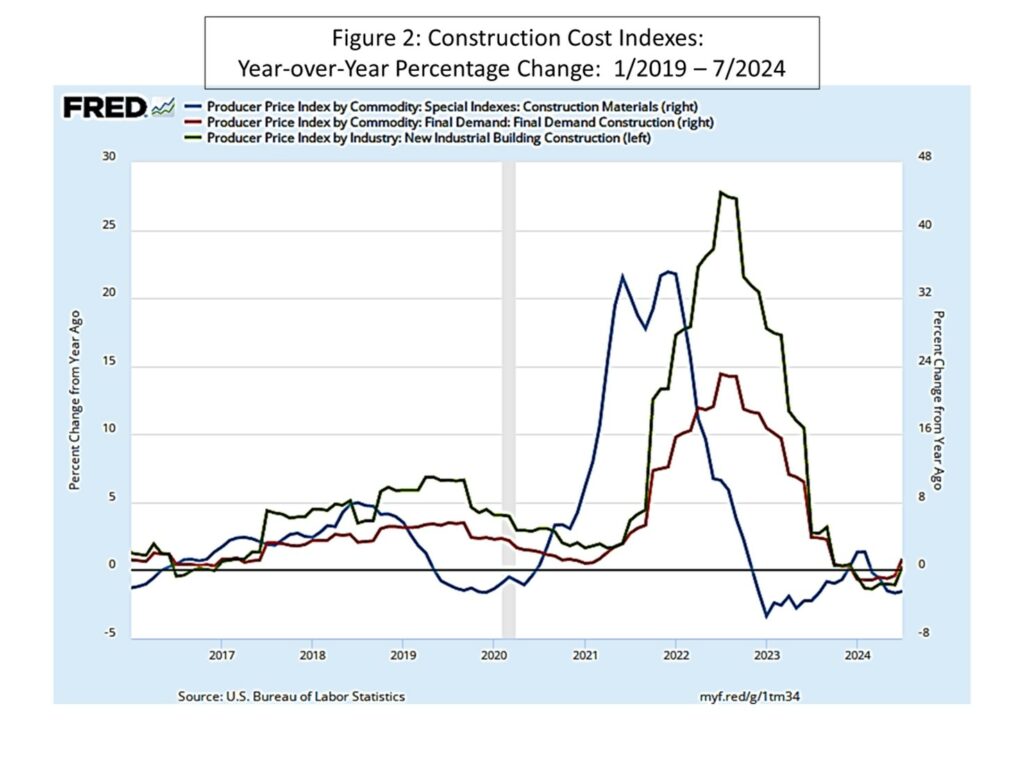
As to inflation, which was caused by free-flowing printing press money and then prompted the Fed’s rate run-up, there is good news. The Personal Consumption Expenditures Price Index, the Federal Reserve System’s favorite inflation measure, rolled in for July at 2.5 percent, the same as for June and a tad lower than May’s 2.6 percent. Perhaps we will see the Fed’s 2.0 percent target achieved in our lifetime, if not sooner.[7] We should certainly see the Fed begin a series of interest rate cuts when it meets later in September. When we focus on the construction industry and the Producer Price Index, we see clearly a picture that says we are over the hump. As shown in Figure 2, price increases have been tamed. Note the lag between year-over-year price increases for construction materials and later construction costs.
The Economy’s Heartbeat
In the next table, I provide an update for three GDP forecasts I follow. There is no recession found in any of them. These are from the Philadelphia Federal Reserve Bank, the Wall Street Journal, and Wells Fargo Economics. The prospects are tepid at best. The three forecasts are remarkably similar. I should point out that the Philadelphia Fed and Wall Street Journal forecasts were published prior to the just mentioned Department of Commerce 3.0 percent second-quarter real GDP growth estimate.
TABLE 1: GDP growth estimates
| 3Q 2024 | 4Q 2024 | 1Q 2025 | 2Q 2025 | |
| Philadelphia Fed | 2.0% | 1.5% | 1.8% | 2.0% |
| Wall Street Journal | 1.6% | 1.5% | 1.7% | 1.9% |
| Wells Fargo Economics | 2.1% | 1.3% | 1.2% | 2.1% |
The Geographic Imprint
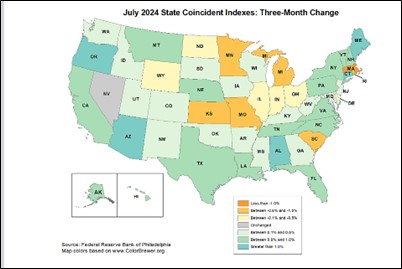
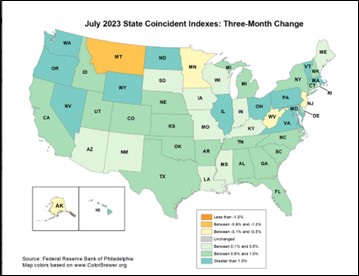
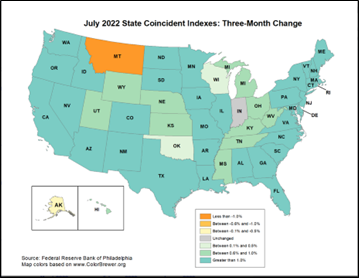
I now show three data maps for July 2022, July 2023, and July 2024 produced by the Philadelphia Fed.[8] These show the three-month growth for state coincident indicators, which are based primarily on labor and housing market conditions. The maps provide a picture of the 2022 prosperity that came when newly printed federal money hit our bank accounts, the slowing that emerged in 2023 when the Fed began to raise interest rates, and the uneven picture now that shows the longer-term effects of those higher interest rates. Mostly likely the next few monthly maps will look even weaker. We are definitely operating in a slowing economy.
Some Final Thoughts
With Fall’s arrival, we can be thankful that we live in America where overall peace prevails and that in spite of the ups and downs we have experienced recently, prosperity still lives on. Because of a troubled world and America’s ongoing efforts to find new footing following COVID, serious economic disruptions, and politics that seeks to divide us, uncertainty is obviously with us. In spite of all this, we must stay in the game, learn from our errors, and adjust to a rapidly changing world.
[1] Parts of this piece are based on my September Economic Situation Report published by the Mercatus Center, https://www.mercatus.org/scholars/bruce-yandle.
[2] https://www.reuters.com/world/us/harris-economic-plan-mirrors-bidens-aims-lower-taxes-prices-2024-08-16/. [2] https://www.reuters.com/world/us/harris-economic-plan-mirrors-bidens-aims-lower-taxes-prices-2024-08-16/
[3] A. G. Gancarski, “Donald Trump Unveils GOP Platform Dedicated to the ‘Forgotten Men and Women of America’,” Florida Politics, July 8, 2024, https://floridapolitics.com/archives/683073-donald-trump-unveils-gop-platform-dedicated-to-the-forgotten-men-and-women-of-america/.
[4] file:///C:/Users/Owner/Downloads/Explainer_UPDebt-1.pdf
[5] This discussion is taken from https://www.newsobserver.com/opinion/us-viewpoints/article290905364.html.
[6] https://www.google.com/search?client=firefox-b-1-d&q=30+year+fixed+rate+mortagage+rate
[7] https://www.ig.com/en-ch/news-and-trade-ideas/Wall-Street-US-stocks-rally-as-PCE-inflation-data-eases-investor-concerns-240902
[8] Federal Reserve Bank of Philadelphia, State Coincident Indexes, June 2024, https://www.philadelphiafed.org/surveys-and-data/regional-economic-analysis/state-coincident-indexes


