National Construction Unemployment Rate Ticks Up to 4.9 Percent in July
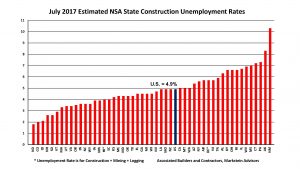
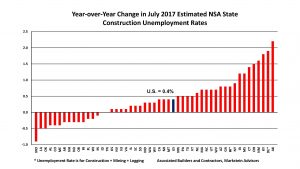
Construction activity across the country was relatively flat through the summer months, and construction industry employment ticked up slightly in July. The national not seasonally adjusted (NSA) construction unemployment rate was 4.9 percent in July, up 0.4 percent from a year ago, but still the third lowest July rate on record—matching the July 2001 rate, the U.S. Bureau of Labor Statistics (BLS) reported. Unemployment rates increased in 34 states on a year-over-year basis, but the construction industry employed 186,000 more workers than in July 2016, according to an analysis released today by Associated Builders and Contractors (ABC). Rates fell in 14 states and were unchanged in two.
In the Carolinas, construction unemployment reflected the national trends. North Carolina was at 4.9 percent in July and up 0.7 percent year-over-year. South Carolina was better at 2.6 percent, up 0.2 percent year-over-year. Finding and retaining skilled construction workers continues to be a challenge for many general contractors and subcontractors in the Carolinas.

“The recent slowdown in construction activity is troubling, but we hope it proves to be a temporary pause. Despite this slowdown, construction employment remains fairly healthy,” said Bernard M. Markstein, Ph.D., president and chief economist of Markstein Advisors, who conducted the analysis for ABC. “The promised federal support for investment in infrastructure is badly needed by the nation and would be a major lift for the industry.”
The national not seasonally adjusted (NSA) construction unemployment rate was 4.9 percent in July, up 0.4 percent from a year ago, but still the third lowest July rate on record—matching the July 2001 rate, the U.S. Bureau of Labor Statistics (BLS) reported. Unemployment rates increased in 34 states on a year-over-year basis, but the construction industry employed 186,000 more workers than in July 2016, according to an analysis released today by Associated Builders and Contractors (ABC). Rates fell in 14 states and were unchanged in two. Because these industry-specific rates are not seasonally adjusted, national and state-level unemployment rates are best evaluated on a year-over-year basis.Reports from the U.S. Census Bureau indicate that construction activity has flattened recently. Even residential construction has leveled off lately. Now, this flattening is adversely affecting the construction unemployment rate.
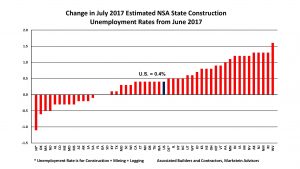
From the beginning of the data series in 2000 through 2016, the monthly national NSA construction unemployment rate from June to July has decreased 13 times, remained unchanged twice and increased twice. This year, the rate increased 0.4 percent from June. Thirty-four states had increases in their July estimated rate from June, 13 were down and three experienced no change.
The Top Five States
The states with the lowest estimated NSA construction unemployment rates in order from the lowest rate to the highest were:
1. North Dakota, 1.8 percent
2. Colorado, 2 percent
3. Idaho, 2.1 percent
4. New Hampshire and South Dakota (tied), 2.6 percent

Four states—Colorado, Idaho, New Hampshire and North Dakota—were also among the top five in June. North Dakota had the lowest rate among the states, up from fourth lowest in June (tied with Colorado) based on revised data.
In second place, Colorado saw its lowest estimated July rate since the 1.9 percent rate in 2000.Idaho had the third lowest July rate, down from the lowest rate in June. It was the state’s lowest July rate on record, matching the July rate in 2007 and 2016.
New Hampshire and South Dakota tied for the fourth lowest rate in July, with a 2.6 percent rate, and the state’s lowest estimated July rate on record. In June, New Hampshire had the third lowest rate.
For South Dakota, this was an improvement from the seventh lowest rate in June. It was also the state’s second lowest July construction unemployment rate since 2007 (1.3 percent).
Vermont, which had the second lowest rate in June, fell to sixth in July, with a 2.9 percent rate.
The Bottom Five States
The states with the highest NSA construction unemployment rates in order from lowest to highest were:
46. Mississippi, 7 percent
47. Connecticut, 7.2 percent
48. Pennsylvania, 7.3 percent
49. Alaska, 8.3 percent
50. New Mexico, 10.3 percent

Four of these states—Alaska, Connecticut, Mississippi and New Mexico—were also among the five states with the highest construction unemployment rates in June. For the second month in a row, New Mexico had the highest estimated NSA construction unemployment rate in the nation. In July it was the only state with a rate exceeding 10 percent.Alaska had the second highest rate in July, compared to third place in June, based on revised data.
Alaska’s economy has been struggling for close to two years with an overall unemployment rate among the nation’s highest. In July, the state posted the largest year-over-year increase in its construction unemployment rate in the country—up 2.2 percent. Clearly, low energy prices are a severe drag on the state’s economy.

Pennsylvania had the third highest estimated NSA construction unemployment rate in July, compared to seventh in June. On the positive side, it was the state’s second lowest July construction unemployment rate since 2007 (6.5 percent).
For the second month in a row, Connecticut had the fourth highest rate. In July, it rose to 7.2 percent from 6.8 percent in June. It was the state’s second lowest July construction unemployment rate since 2007 (6.6 percent).Mississippi had the fifth highest rate in July, an improvement from second highest in June based on revised data.
Alabama, which had the fifth highest rate in June based on revised data, improved to the 11th highest rate in July with a 6.3 percent rate. It was also the state’s lowest July NSA construction unemployment rate since the 5.4 percent rate in 2007.To better understand the basis for calculating unemployment rates and what they measure, see the article Background on State Construction Unemployment Rates.
July 2017 State Construction Unemployment Rates: Graphics/Spreadsheets


