


The Economic Situation and What Lies Ahead
With the books for 2025 ready to be closed and knuckles still white from the roller coaster ride generated by President Trump’s first year policy actions, and all this compounded by war, terrorist attacks, and a recovering post-COVID world, I begin this report with a summary forecast for the next four quarters. I offer thoughts on inflation, interest rates, and other forces at play in the economy. Throughout, my focus will be on the national and global economies. That said, it’s important to consider some fundamental regional data before pushing ahead.
Figure 1 shows 12-month growth in state GDP across 2Q2024 and 2Q2025. As indicated, the expanding energy economies in the nation’s mid-section have caused those states to replace the Southeast as the highest growth region. Even so, I note that the two Carolinas are still performing at a healthy pace.

The Year Ahead and Policy Uncertainty
Though the year ahead will be fraught with uncertainty, I expect we will see slightly better than 2 percent real GDP growth across 2026, with inflation running 2.75 percent annually, the 10-year bond yield hitting between 4.0 to 4.2 percent and a lot of surprises delivered by the Trump administration. Uncertainty is high in our top-down, White House managed economy where court decisions can lead to major policy reversals and political necessity inspires the president to either reward favored firms, industries and countries or punish the disfavored.
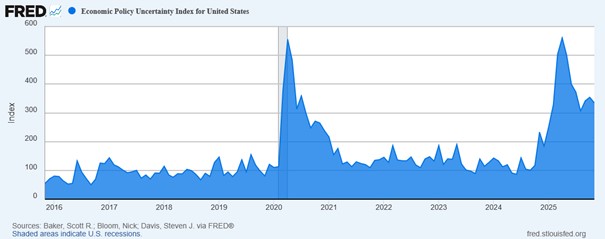
The tendency of the Trump administration to make headline-generating major policy changes generates costly uncertainty that causes economic decision makers to hunker down and postpone risky decisions. Figure 2, shows monthly values for the U.S. Economic Policy Uncertainty Index, which is based on the frequency of particular words found in a sample of daily newspapers and which correlates with reductions in economic activities. Note that April 2025 marks the recent peak. This was the month when Trump announced the start of his global trade war and the beginning of America’s golden age. The level of uncertainty then was about the same as that in 2020 associated with the start of the COVID pandemic and shutdown of the U.S. economy.
Buried beneath all this, we have a burgeoning AI economy and the start of an industrial revolution being formed by way of massive data centers and power investments. Data center investment is a major GDP driver.
Giving some dimensions to this, a recent McKinsey & Co. report on data center investment worldwide indicated:
“Our analysis shows that by 2030, companies will invest almost $7 trillion in capital expenditures on data center infrastructure globally. More than $4 trillion of it will go toward computing-hardware investments, with the balance going toward areas such as real estate and power infrastructure. More than 40 percent of this spending will be invested in the United States.” (Emphasis added.)
I note that 40% of $7 trillion is $2.8 trillion, which approximates $580 billion per year for the U.S. share. To give perspective, in February 2025 total investment in U.S. plant and equipment of all forms was hitting an annual rate of $225 billion. The expected data center investment is unprecedented.
GDP Growth and Employment
Table 1 provides quarterly GDP growth estimates for three forecast groups I follow closely. I note that the weak growth estimates are closely nested and that there are no negative numbers, and that the weaker growth corresponds with what is going on in labor markets.
| 1Q-2026 (%) | 2Q-2026 (%) | 3Q-2026 (%) | 4Q-2026 (%) | |
| Philadelphia Fed | 3.4 | 2.2 | 2.5 | 2.0 |
| Wall Steet Journal | 1.6 | 2.5 | 2.2 | 1.5 |
| Wells Fargo | 1.6 | 1.7 | 1.9 | 1.7 |
Table 1 | Real GDP Growth
Sources: https://www.philadelphiafed.org/surveys-and-data/real-time-data-research/spf-q4-2025. https://www.wsj.com/economy/economic-forecasting-survey-archive-11617814998?gaa_at=eafs&gaa_n=AWEtsqeqRhxEL0LghH-clLhiVRCJsazsnuGr0IPo5dtqydi8nsKAgptrPbSaZ6Vy3_k%3D&gaa_ts=6931dffa&gaa_sig=J1M9Q7df5Zzj8UvLPv_htiyFEwGYjE80y6komjtcyF7HVQM93Fi3coBiAHlI7f3PMqaoqWd-7uYA2DnkOzO6xg%3D%3D. https://wellsfargo.bluematrix.com/docs/html/92f82925-5c51-4853-bc41-3736a0e97809.html
Most recently, ADP indicated the US labor force growth has been falling since March and lost 32,000 workers in November, which implies that GDP growth will be determined largely by investment and growth in productivity.
Trying to Understand What’s Going On
Like many economy observers, I’ve struggled this year to find a theoretical framework that explains the many swoops and turns we have experienced while riding the U.S. 2025 policy roller coaster. What we are experiencing is not just the result of ongoing battles between Republicans and Democrats. The major policy changes we are observing are the result of the global COVID catastrophe that killed millions, destabilized politically weak regimes, and led to massive migration flows. We have a world economy that is searching for a new equilibrium.
Then, to top it off, global markets are simultaneously reacting to revolutionary changes in AI-inspired knowledge technologies. As Nobel Laureate Frederich Hayek reminded us decades ago, the economic problem is fundamentally a knowledge problem: Knowledge is diffused across billions of individuals, while the need for knowledge to act is concentrated. With AI, the cost of accessing all those brains is plummeting.
As I see things now, these changes have led nations worldwide to hunker down, centralize decision-making, increase regulation, and print money to ease the pain of change. Inflation and revolution have followed. Coming out of all this are social movements marked by populism wrapped in a heavy cloak of nationalism. But Hayek also reminded us of the fatal conceit that causes people in power to think they can assemble the brightest and best minds and, armed with reports, studies, and information, proceed to outthink and outperform what decentralized, free-market forces can provide.
Looking for the Effects
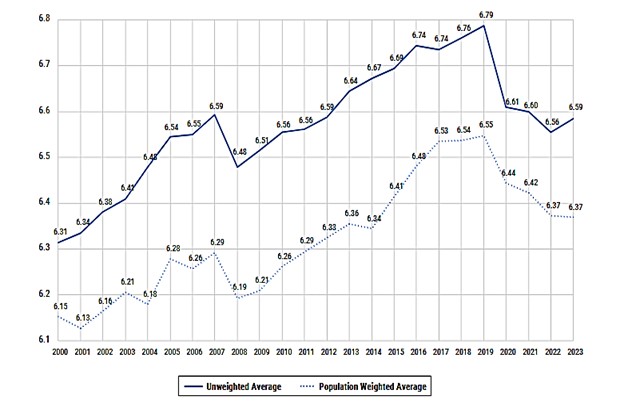
The effects of COVID-related centralized decision-making and increased regulation may be seen in the recently released Fraser Institute 2025 report on Economic Freedom of the World. Fraser’s freedom index rates up to 165 countries from 1970 through 2023 using five data categories: size of government, legal system and property rights, sound money, freedom to trade internationally, and regulation. When COVID hit, each of the five categories was affected by national governments to soften the pandemic’s effects. For the years 2000 through 2023, data for the average value of the overall index, unweighted and weighted by population, are shown in Figure 1 below. I call attention to the sharp decline that started in 2019 with a small recovery in 2023. In effect, 10 years of gains in freedom were erased by pandemic and related effects. I note that the top five free countries for 2023 are Hong Kong, Singapore, New Zealand, Switzerland, and the United States.
More on the US Picture
Given deportations and an aging population, US employment growth is falling. This presents a challenge for those who are counting on higher GDP growth. Estimates by the Pew Center indicate 750,000 immigrant workers have left the labor force since January 2025, and efforts by the Trump administration to ease the situation by accelerating use of a special visa for temporary agriculture workers have been snarled by the government shutdown.
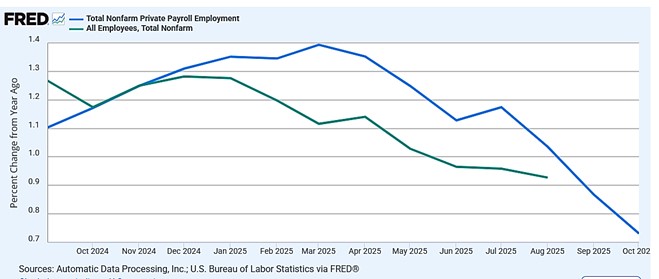
Most recently, ADP indicated the US labor force lost 32,000 workers in November. Figure 3 below shows growth in private payrolls using BLS (green) and ADP (blue) data. I note that the abbreviated BLS is due to the government shutdown.
What about Construction?
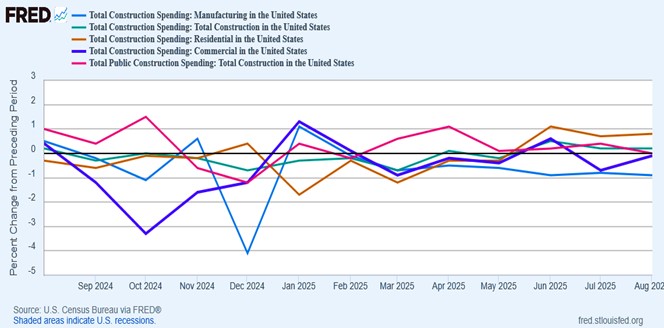
While total U.S. construction spending is not moving at a lively pace, as shown in Figure 4, there is some movement out of the cellar. Two sectors deserve attention. As shown by the orange line, the combination of falling interest rates and pent-up demand for homes has led to a surge in spending on residential construction. Partly because of aging and past high mortgage rates that sharply affect affordability, U.S. population mobility, the share that moves each year, is hitting a 50-year low. It was 11% in 2024, compared to twice that in the 1960s.
We will continue to have pent-up demand for housing, and falling mortgage rates will enliven things. But, remote employment and other COVID-induced work changes have changed the relationship between work and home. Commercial construction, shown by the purple line in Figure 4, is the second lively sector. This is led by the previously discussed explosive expansion of data centers for servicing AI.
Final Thoughts
A close look at the U.S. economy reveals a mixed bag, what some call a K-shaped economy. Depending on the political forces at play, some sectors are booming, EV auto battery production and electricity power plants, for example. Others are losing ground. Those invested in the hot AI and information sectors are laughing all the way to the bank. Also, vast owners of 401-Ks are cheering the S&P 500 as it hits higher ground. Meanwhile, operators of small businesses struggle to find workers and keep down costs. Yes, we do seem to have a K-shaped economy, and when combined, the two legs of are yielding low-level GDP growth.
It’s important to remember, though, ordinary people do not live off GDP. It is income, investment gains, and business profits that make their days better. As things stand, 2026 promises to come with a sturdy foundation for economic action. But where one sits in the roller coaster will determine whether the year will set a record for new prosperity or learning how to deal with a constantly changing field of work.


