


The Mid-Year Roller Coaster Economy
As we approach mid-year, this is a good time to assess the economic situation. First, we will focus on the nation. Then, the Carolinas. As indicated in the next chart, the latest Commerce Department estimate for first quarter GDP growth for the nation shows negative growth. I point out that the estimate was troubled by extraordinary actions taken to avoid the expected effects of tariffs on future prices. The prospects for the year ahead, based on three forecasters that I follow, are shown in Table 1. These are weak, but a bit stronger. I note that Wells Fargo has assigned larger negative impact from the pending and uncertain trade war than the other two forecast groups. Even so, we do not see a recession in the forecasts, which would be indicated by two consecutive quarters of negative GDP growth.
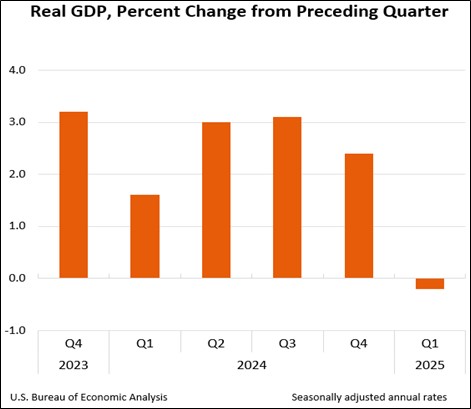
Table 1: GDP Growth Estimates
| 2Q 2025 | 3Q 2025 | 4Q 2025 | 1Q 2026 | |
| Philadelphia Fed | 1.5% | 0.9% | 1.4% | 1.7% |
| Wall Street Journal | 0.8 | 0.6 | 1.1 | 1.6 |
| Wells Fargo Economics | 1.6 | -1.5 | 0.3 | 0.8 |
Sources: https://www.philadelphiafed.org/surveys-and-data/real-time-data-research/spf-q2-2025; https://www.wsj.com/economy/economic-forecasting-survey-archive-11617814998; and https://wellsfargo.bluematrix.com/docs/html/88d2eafa-3a64-4cca-b013-4093132d9c99.html.
Along with the slower growth expectations, we are getting healthier numbers on inflation. The Personal Consumption Expenditures Index for April showed an annual growth rate of 2.1%, which is right in the Federal Reserve’s 2.0% target. Of course, there is still uncertainty regarding tariff-driven price increases that may show up later in the year, and Walmart and other retailers promise increases are on the way.
Because of Trump administration actions taken, reversed, and pending, we have the highest level of uncertainty recorded in modern times. We must grant that the Trump administration is just getting started and there are unprecedented and dramatic policy changes underway for reforming the federal government and reorganizing world trade. In a fundamental sense, some of the changes are necessary. We have a debt-driven economy that cannot be sustained.
Coming to Grips with Debt
No matter political preferences, many would agree, some perhaps grudgingly, that the excessive government actions taken during the COVID years had to be reined in. The data for federal debt as a share of GDP are shown in the accompanying chart. I call attention to the COVID years spike but also to the surge that started with the 2008 recession.
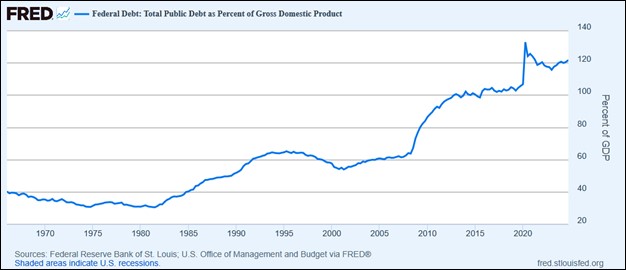
During COVID, federal spending skyrocketed in a combined effort to control the pandemic’s deadly spread and with massive stimulus funding to soften the personal and business hardships that arose when the economy was basically shuttered.
The pandemic led government to exercise emergency powers. Federal spending rose 50% during the 2019-2021 COVID years. Both the Trump and Biden administrations opened the spending valves and spent trillions to fund stimulus and public health programs. According to a Tax Policy Center analysis, the direct and indirect spending for COVID raised the deficit to 14.9% of GDP in 2020 and 12.4% in 2021, the largest shares since World War II. The deficits drove up the national debt from 79% of GDP at the end of fiscal year 2019 to 124% at the end of 2024.
While COVID spending ended with the pandemic’s passing, the cost of the COVID debt lived on. We now find interest on the debt, following Social Security spending, to be second largest item in the federal budget. We must now struggle to pay off $45.46 trillion in federal debt, up from $19.98 trillion in 2016. The annual interest cost of the debt, running $579 billion thus far in fiscal 2025, is the second largest item in the federal budget.
Yes, reforming the debt-driven economy is necessary.
Looking on the Brighter Side
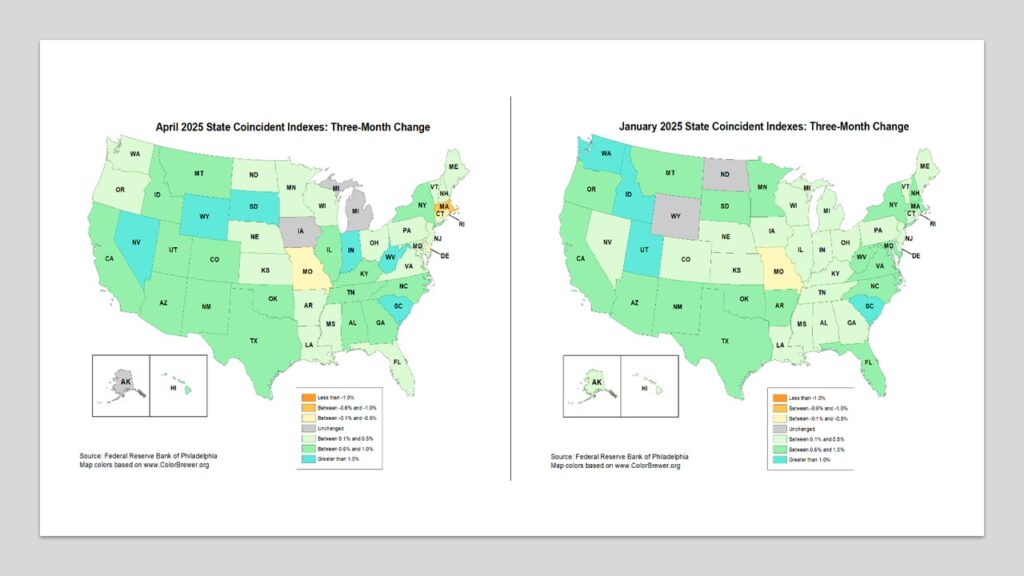
While the outlook for the national economy is plagued with uncertainty over yet-to-be finalized policy actions, hard data on recent economic activity across the 50 states offer a more positive outlook. I next show two 50-state outline charts for changes in coincident indicators prepared by the Federal Reserve Bank of Philadelphia. The first chart reports April data; the second, January. I call attention first to the two Carolinas. For April, South Carolina is one of the strongest states in the country. North Carolina is healthy too. I next point out that there are just three states showing negative change for April: Iowa, Michigan, and Missouri. Finally, close comparison of the two charts confirms that the economy is strengthening. April is healthier than January.
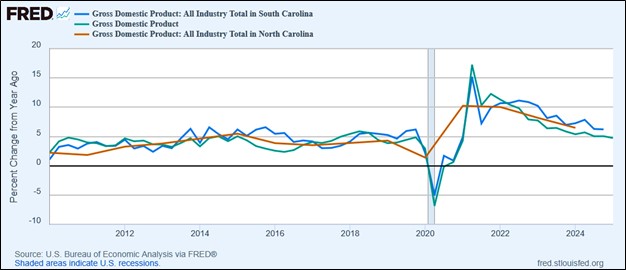
Drilling down a bit deeper into the Carolinas’ performance, we find that when state GDP growth is compared with the nation’s growth, both Carolinas are stronger in recent years.
Final Thoughts
We live in interesting times, to put it mildly. With respect to massive reforms underway, we might say “It will all come out in the wash, but it is hell going through the wringer.” Or we might just conclude by saying Elvis got it right: “We are all shook up.” In any case, we can hope that 2025 will be remembered as a transition year. Let us hope that it is a transition to something better.


